| Name | Value, MPa |
|---|---|
| Maximum normal stresses | {{max_sigma}} |
| Maximum shear stresses | {{max_j}} |
| Name | Value, MPa |
|---|---|
| Normal stresses | {{sigma}} |
| Shear stresses | {{j}} |
| Total stresses | {{napr_all}} |
| Name | Value, MPa |
|---|---|
| Maximum normal stresses | {{max_sigma}} |
| Maximum shear stresses | {{max_j}} |
| Name | Value, MPa |
|---|---|
| Normal stresses | {{sigma3}} |
| Shear stresses | {{j3}} |
| Total stresses | {{napr_all3}} |
| Name | Value, MPa |
|---|---|
| Maximum normal stresses | {{max_sigma}} |
| Maximum shear stresses | {{max_j}} |
| Name | Value, MPa |
|---|---|
| Normal stresses | {{sigma4}} |
| Shear stresses | {{j4}} |
| Total stresses | {{napr_all4}} |
| Name | Value, MPa |
|---|---|
| Maximum normal stresses | {{max_sigma}} |
| Maximum shear stresses | {{max_j}} |
| Name | Value, MPa |
|---|---|
| Normal stresses | {{sigma5}} |
| Shear stresses | {{j5}} |
| Total stresses | {{napr_all5}} |
| Name | Value, MPa |
|---|---|
| Maximum normal stresses | {{max_sigma}} |
| Maximum shear stresses | {{max_j}} |
| Name | Value, MPa |
|---|---|
| Normal stresses | {{sigma6}} |
| Shear stresses | {{j6}} |
| Total stresses | {{napr_all6}} |
| Name | Value, MPa |
|---|---|
| Maximum normal stresses | {{max_sigma}} |
| Maximum shear stresses | {{max_j}} |
| Name | Value, MPa |
|---|---|
| Normal stresses | {{sigma7}} |
| Shear stresses | {{j7}} |
| Total stresses | {{napr_all7}} |
| Name | Value, MPa |
|---|---|
| Maximum normal stresses | {{max_sigma}} |
| Maximum shear stresses | {{max_j}} |
| Name | Value, MPa |
|---|---|
| Normal stresses | {{sigma8}} |
| Shear stresses | {{j8}} |
| Total stresses | {{napr_all8}} |
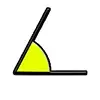
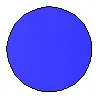
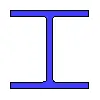
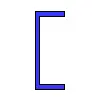
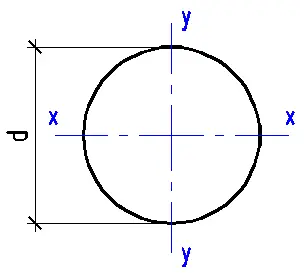
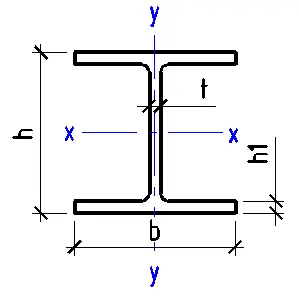
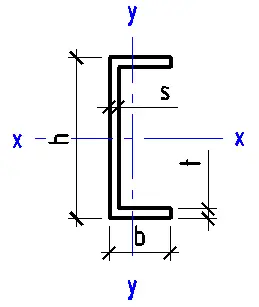
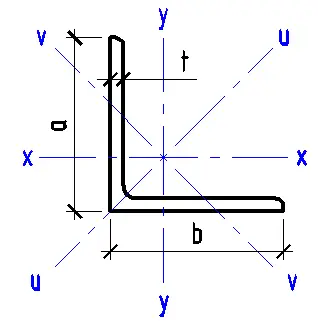
This Stress Distribution tool is designed to compute normal and shear stress distributions for various cross-sections, including circular, I-beam, channel, angle, rectangular, hollow section, and T-beam profiles.
Using the generated stress diagrams, engineers can identify critical zones within the cross-section by entering the bending moment and shear force values and comparing them with the calculated material resistance.
The bending moment (M) and shear force (Q) are determined as follows:

The most critical cross-section of the beam is highlighted in green. In this section, the maximum bending moment is M = 400 and the shear force is Q = 185 + 70.7 = 255.7.
Instructions:
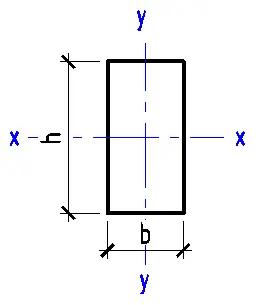
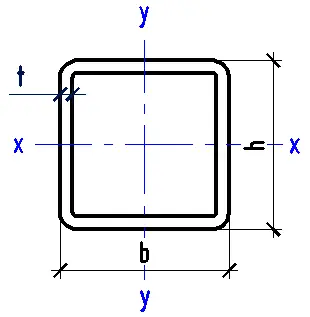
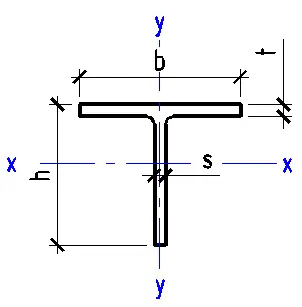
- Select the type of cross-section (circular, I-beam, channel, angle, rectangular, hollow section, or T-beam).
- Enter the geometric characteristics of the chosen cross-section.
- Specify the bending moment (M) in your preferred units of measurement.
- Input the shear force (Q) in your preferred units of measurement.
- Click the "Calculate" button.
The results include generated stress distribution plots for normal and shear stresses, as well as a visual representation of the cross-section.
For convenience, the maximum stress values (in MPa) are displayed in the table below.
If needed, you can evaluate the stress at any point along the height of the cross-section. Simply check the "Determine stress by height" box and specify the distance from the centroid (indicated by the red dashed line) to your point of interest.
The most critical cross-section of the beam is highlighted in green. In this section, the maximum bending moment is M = 400 and the shear force is Q = 185 + 70.7 = 255.7.
Instructions:
- Select the type of cross-section (circular, I-beam, channel, angle, rectangular, hollow section, or T-beam).
- Enter the geometric characteristics of the cross-section.
- Specify the bending moment (M) in the chosen units of measurement.
- Enter the shear force (Q) in the chosen units of measurement.
- Click the "Calculate" button.
The result will include the constructed diagrams of normal and shear stresses, as well as an image of the cross-section.
For convenience, the maximum stress values (in MPa) will be displayed in the table below.
If needed, you can determine the stress at any point along the height of the cross-section. To do this, check the "Determine stress by height" box and specify the distance from the centroid (marked by the red dashed line) to the desired point.
Additional information:
- Overall stresses are calculated using the third strength theory.
- To determine the bending moment M and shear force Q, use this calculator.